 is defined in terms of the exponential function as follows
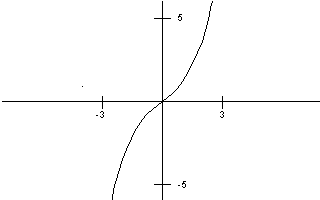
Graphing y = Sinh x
We know that  is defined in terms of the exponential function as follows

By rewriting the function as

we can analyze the signs which this function takes for various values of x.
If x < 0, (the second factor in the numerator)  < 0 ; and if x > 0, the expression
  > 0.
> 0.
So, since  is always positive, and the denominator (= 2) of
  is always positive, we have that

So, the graph of the function  is negative when x < 0, the graph of the function is positive when x > 0, and the graph equals 0 when x = 0 (plug x = 0 into the exponential form of
  ).
).
Now, we take the derivative of  and obtain

If we analyze the signs for this function which can be rewritten as

and note that both factors in the numerator are positive for all values of x we obtain that

Thus, the derivative of  is positive for all values of x, and so the graph is always increasing.
Finally, we take the second derivative of  . But the second derivative is

and so the same analysis for signs applies for the second derivative as did for the function itself. That is, for x < 0, the second derivative is negative and so the graph is concave down, and for x > 0, the second derivative is positive and so the graph is concave up.
Below is the graph of  .
.
