 the graph of
  is always increasing. This is most easily verified by noting the derivative of
  is
is  and that on the interval
  (i.e. quadrants I and IV) we have that
  .
.Graphing Sin -1 x
On the interval, the graph of
  is always increasing. This is most easily verified by noting the derivative of
  is
is  and that on the interval
  (i.e. quadrants I and IV) we have that
  .
.
When a function is always increasing (or decreasing) - this property is called monotonic - it will have an inverse. So, we will find the inverse of  on the interval
  .
.
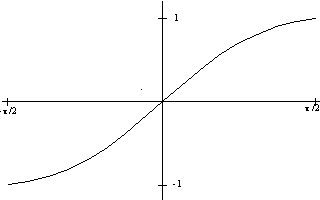
The graph of  on the interval
  looks like:

When a function has an inverse, we can find this inverse by transitioning the graph through two rotations.
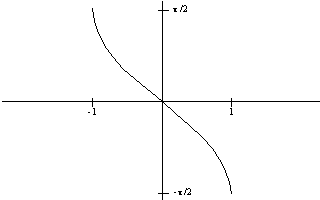
First, we rotate the graph and the axes counter-clockwise about the origin 90 degrees -- so, the y-axis becomes the x-axis and vice-versa. This changes the above graph as below:

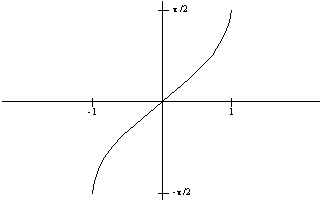
Next, we keep the y-axis in the same position as above, but rotate the graph (and the x-axis) 180 degrees about the y-axis. This changes the above graph into the inverse of the original function:
